
The inductance of power chokes changes with current level. Conventional small-signal-measuring bridges are out of their depth here!
Hubert Kreis, ed-k • Alan Lowne, Saelig Co. Inc.

With the exception of air-core coils, all power inductances show a saturation behavior; their inductance drops with rising current. The core materials can lose permeability and then behave like an air core in extreme cases. That saturation behavior limit can be influenced by the choice of core material, the core geometry, the number of turns, and the air gap.
There are often deviations between the calculated inductance at a certain current (e.g. the nominal current) and the real inductance, perhaps because the choke geometry causes a non-homogeneous field distribution, or the data sheet information of the cores is incomplete. Manufacturing variations of core tolerances are often noticeable, as well as temperature influences. So the saturation behavior of power chokes must be measured during product development and also during quality inspection.
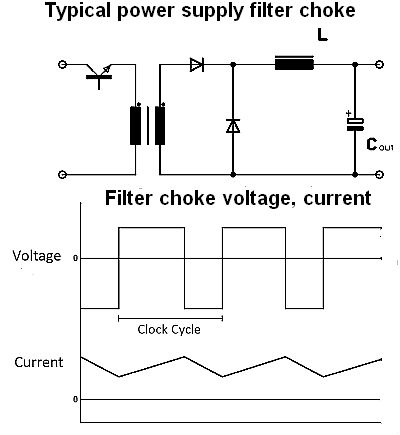
Power chokes serve in many applications: smoothing chokes for switch-mode power supplies, filter chokes for IGBT converters (sine filter), an impedance for line-commutated converters, a smoothing reactance for dc circuit blocks, and so forth. A common application is as a smoothing choke in the secondary of a switch-mode power supply. Here the voltage output from the switch typically has a rectangular shape. The output current is basically dc with a superimposed ripple that resembles a triangular wave having a frequency corresponding to the circuit clock frequency – from a few hundred hertz up to several megahertz.
For the circuit designer, the spec sheet value for the inductor in this circuit is usually not particularly useful. More meaningful is the inductance at the highest-occurring direct current. Inductance at this level affects the superimposed ripple current (and thus the residual ripple of the power supply) as well as the maximum current through the switching power semiconductor. If the choke effect goes into saturation before reaching the desired maximum output current, bad things happen. Power semiconductors can be damaged or overheat, the output capacitor could overload, and the ripple on the output would rise sharply.
The problem is basically the same in other circuit topologies and applications employing power chokes, such as sinusoidal filters for IGBT converters. Standard small-signal-measuring bridges don’t provide insights into inductor behavior at high currents because they only measure the initial inductance using extremely small measurement currents. Measurement of the saturation behavior requires putting a corresponding high current through the choke. It is also important to realize that the inductance of each choke is frequency-dependent.
Fixed frequency measurements
There are basically two different measurement methods for inductance: the fixed-frequency method used by LCR meters and the pulse measurement di/dt method. Fixed-frequency methods feed a direct current to the DUT. A sinusoidal small-signal measurement voltage (e.g. 10 kHz) is superimposed on the current, and the inductance is calculated from the amplitude and the phase of the measured current.
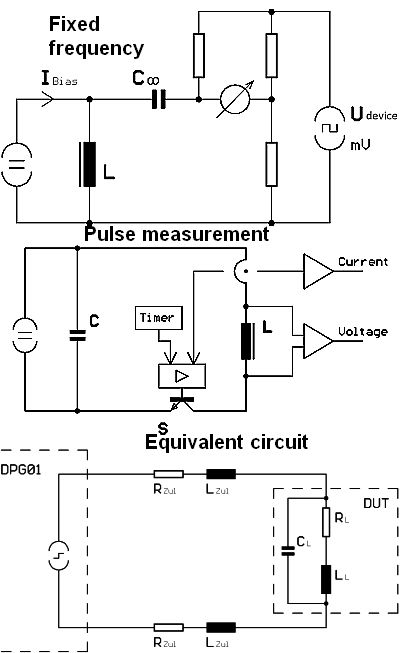
The advantage of this method is that the measurement frequency is set precisely and reproducibly. However, the problem here is that the measurement conditions have little to do with the real-world application conditions. Power chokes don’t normally see a low-voltage sinusoid but rather a rectangular voltage containing multiple harmonics. Real-world conditions require a powerful dc source, which can be expensive for larger currents (e.g. over 20 A). Moreover, inductor characterization over the whole direct-current range requires many individual measurements taken at different current levels.
In contrast with fixed-frequency methods, measurements with the pulse di/dt method subject the test object to a square-wave voltage pulse mimicking that in the real-world. Current is applied to the DUT while both the current di/dt rise and the saturation behavior is observed for the inductance estimation. The measurement pulse stops when a preset maximum current is reached. Evaluating the rate-of-rise di/dt of the current creates a complete inductance curve for the test object with a single pulse.
Ideally, the pulse voltage corresponds to what the device sees in the real-world to avoid the error-prone results from a small-signal fixed frequency measurement. An additional advantage of the pulse-shape measurement is that the current source need not deliver the test current continuously; a capacitor bank can deliver the test energy. This approach saves considerable cost and reduces the size of the test instrument.
A point to note is that the voltage UDUT of the measurement pulse at the DUT is never constant because of parasitic voltage drops on the supply lines. The ohmic resistance, RL, of the DUT itself must also be taken into account though the DUT parasitic capacitance CL can almost always be neglected. The following equation then gives inductor inductance LL:
LL(i) = [UDUT (i) – RL × i] × dt/di (1)
The pulse method employs individual measurement pulses. Thus, the voltage at–and the current through–the DUT both must be recorded for evaluating the shape of the inductance curve. This recording takes place via a fast and accurate A/D converter with high resolution.
In plots of measurement current and voltage using this method, it is often possible to at first glance see where a choke goes into hard saturation based on the slew rate of the measuring current. For a more precise result, or the creation of an inductance curve, a numerical evaluation necessary. The signal evaluation (the calculation of the inductance curve) relies on equation one.
Increments for Δi or Δt must be carefully chosen. If the step size is too small, even small digitization errors will result in fluctuating inductance curves. Step sizes that are too big won’t accurately reproduce sudden saturation phenomena. What is needed, therefore, is a dynamic step size control in which the step size automatically adapts depending on di/dt results.
Measurements in practice

Its inherent advantages have made the Pulse Measurement procedure a standard for assessing the true inductance of power chokes worldwide. The DPG10 Power Choke Tester from German company ed-k embodies the pulse measurement method for currents from 0.1 to 4,000 A, allowing measurement of the saturation behavior for even large power inductances. The voltage of the measurement pulse can be set from 10 to 400 V, so any inductance can see a voltage present in the real application (e.g. filter inductor for a sine inverter output around 400 V, or a smoothing choke for a 5-V output of an ac/dc converter around 20 V). The duration of the measurement pulse can be pre-set from 3 µsec to 70 msec. The maximum possible pulse energy is limited by the internal capacitor bank supplying the measurement current. At maximum measuring voltage, it is up to 8 kJ. This is enough even for large power chokes.
The DPG10 Power Choke Tester with its fast IGBT switch design handles almost all types of inductive components, from small SMD chokes to power chokes in the MVA range weighing several tons. An attached PC allows the DPG10 to make automatic inductance measurements, displaying the results that include ohmic resistance. The results are available quickly, and test procedures don’t heat up the test specimen.
The measurement protocol determines the inductance curve as a function of current, both as a diagram and in tabular form. It is not unusual to see a nominal value of inductance that is well below that of the inductance at the real peak current after the superimposed current ripple is figured in. For the circuit designer this underspecification can have negative effects on the power semiconductors, the line perturbations, and the losses.


Leave a Reply