
Traditional ways of calculating the loss in inductors and other kinds of magnetic components have well-chronicled short comings that suppliers are beginning to address.
RANJITH BRAMANPALLI | WURTH ELECTRONIK
IN A SWITCH MODE POWER SUPPLY (SMPS) most of the power losses take the form of switching and magnetic losses. Magnetic loss stems from the core and the windings in the storage/coupled Inductor. It has become more important to determine the inductor power loss accurately in the quest for higher energy efficiency and green technology. The estimation of core losses in a SMPS can require complex measurement set-ups, yet there’s no guarantee that the resulting estimates will apply in the particular application at hand.
Historically, core losses are calculated using the Steinmetz equation and extensions of it. These equations can estimate losses reliably only for certain conditions or materials. Fortunately, new models have been developed to determine core losses effectively and accurately.
In a SMPS, the Inductor acts as storage component. It stores energy in the form of a magnetic field during the switching-cycle ON time and delivers its energy to the load during the OFF time. Usually, an inductor consists of a coil predominantly made of copper wire and a core which has magnetic properties. In terms of electromagnetic physics, a magneto-motive force with respect to the time applied to the coil induces magnetic flux Ø(t). An important point is that at any location, the magnetic flux density B is always proportional to field intensity H.
B(t) = μrμoH(t)
where B is the magnetic flux density(Ø/A), μr is the permeability of the material, μo is the permeability of air, and H is the magnetic field intensity.
The coil is wound around or placed inside the core with an air gap to tap the magnetic field effectively. The core contains the air gap. The core is usually a ferrite material which has ferromagnetic properties and much higher permeability than air. Hence, the air gap places a high reluctance element of air in series with low-reluctance ferrite material, thereby locating the bulk of the energy in the air gap.
Inductors operate according to the laws of Ampere and Faraday. Ampere’s Law relates current in the coil or turns of wire to the magnetic field in the core of the inductor. As an approximation, one assumes the magnetic field in the inductor’s core is uniform throughout the core length (le). That assumption lets us write Ampere’s law as
H × le = N × I
where N is the number of turns of the coil around the inductor core and I is the inductor current.
According to Faraday’s Law, voltage applied across the Inductor is
From above theories inductor value is calculated as

where Ac is core cross-sectional area.
Because ferrite materials have high permeability, they offer an easy path for magnetic flux (low reluctance). This characteristic helps contain the flux within the inductor’s core, which in turn enables the construction of inductors with high values and small size. This advantage is evident in the inductance equation above, in which a core material with a high permeability value allows for a smaller cross-sectional area.
In a SMPS the peak magnetic flux density can be written as
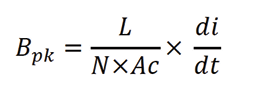
Coupled inductors (sometimes flyback transformers) are also inductors but with multiple windings. The windings do have some special issues but their core properties remain same.
Power dissipation in an Inductor happens in the windings and the core. These are losses and are termed winding losses and core losses.
The power dissipation arises in windings due to the dc resistance (RDC) of the windings and because of phenomena such as skin effect and proximity effect. The loss due to dc resistance (Ldc) can be estimated using the equation:
Ldc = I2 × RDC
The losses arising due to the skin and proximity effects can be termed the ac resistance (RAC) of the winding, which predominantly depends on operating frequency. There are a few techniques to determine these effects in magnetic components, but one would have to follow complicated procedures like Dowell’s method to estimate these losses.
For core loss, B is measured as H is increased. The response of B versus H is nonlinear and exhibits hysteresis, hence the name hysteresis loop. Hysteresis is one of the core-material qualities that will cause power losses in the inductor core.
Energy loss due to the changing magnetic energy in the core during a switching cycle equals the difference between magnetic energy put into the core during the on time and the magnetic energy extracted from the core during the off time.
Using Ampere’s and Faraday’s Law, the energy in the core can be expressed as:

Energy lost in the core is the area traced out by the B-H loop multiplied by the core’s volume. The power loss is this energy (E) multiplied by the switching frequency.
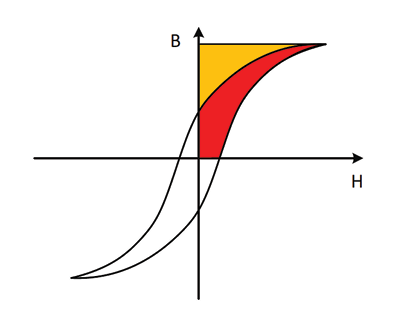
This expression applies as long as the core is not driven into saturation and the switching frequency lies in the intended (linear) operating range. The hysteresis loop area represents energy loss. Power loss depends on how many times per second the hysteresis loop is traversed. Thus, hysteresis loss varies directly with frequency.
The second type of core loss is due to eddy currents, which are induced in the core material by a time-varying flux(dØ)/dt) . According to Lenz’s Law, a changing flux induces a current that induces a flux in opposition to the initial flux. This eddy current flows in the conductive core material and produces losses of I2R.
Determining losses
Historically, core losses are estimated by using the power equation, also called Steinmetz equation.
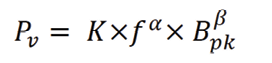
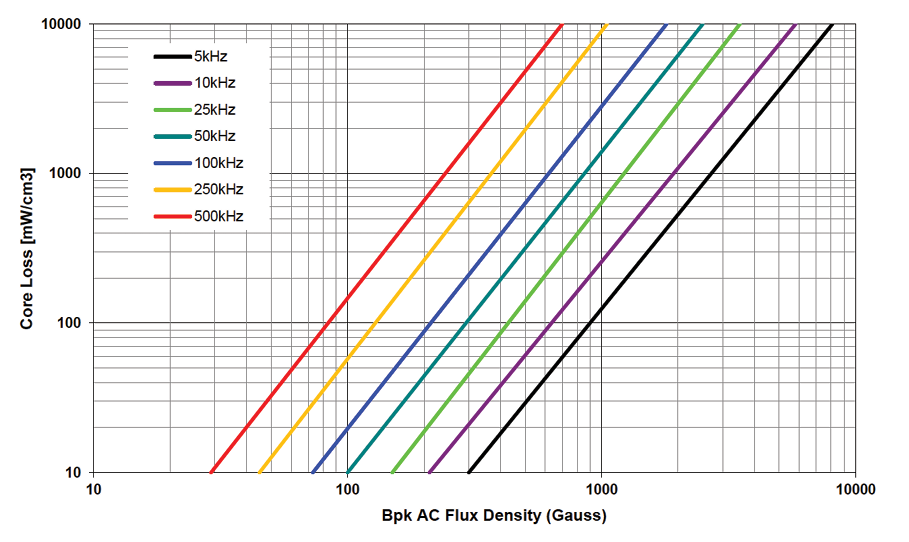
where Pv is the core loss (hysteresis and eddy current loss) for unit volume, f is the frequency, Bpk is peak flux density of a sinusoidal excitation, and K, α and β are the constants derived from core loss graph. The data given for core losses usually includes the effects of both hysteresis and core eddy currents.
Core-loss measurements are difficult because they require complicated setups for measuring flux density and because they involve the estimation of hysteresis-loop areas. For plotting core loss charts, a sine wave is applied to a toroidal (ring) core with one or two one-turn coil windings. Then the constants are calculated using the graph of core loss graph plotted against peak flux density.
The major drawback of the Steinmetz equation is that it is mostly valid for sinusoidal excitation. This is a huge drawback because in most power electronic applications, the inductor is usually exposed to non-sinusoidal flux waveforms. There are other models which separate hysteresis and eddy current loss to overcome the problem of non-sinusoidal waveforms. But the empirical Steinmetz equation has proven to be the most useful tool for sinusoidal flux-waveforms because it provides better accuracy and is quite simple to use. Hence there are extensions to this power equation to make it more accurate for non-sinusoidal flux waveforms.
To utilize the Steinmetz equation for non-sinusoidal waveforms in the estimation of core losses, a later extension, the Modified Steinmetz Equation (MSE) has been used widely.
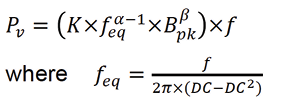
feq being the equivalent frequency with respect to change in the duty cycle (DC) of non-sinusoidal waveforms.
The MSE has some disadvantages. The Generalized Steinmetz Equation (GSE) was developed to overcome them:
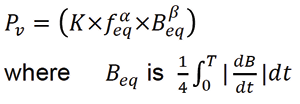
As the GSE and MSE core loss charts are also based on sinusoidal excitation, they also have some limitations. And some core manufacturers also have devised their own models which work best with the cores they themselves manufacture.
The major disadvantages of the Steinmetz and its extended models include the fact that they depend on empirical data of the core manufacturer (for core loss charts). This means the firm manufacturing the passive component using the magnetic core has no control over the test setup, which can be quite complicated. These models also have a low accuracy with pulsating and triangular waveforms that characterize the SMPS. This is because the core loss graphs are created using the data from sinusoidal excitation. Similarly, extensions of Steinmetz models work best only for 50% duty cycle and limited frequency ranges.
There are other problems. Due to the complexity of estimating magnetic path length, it is challenging to estimate core loss using existing models for iron powder materials and metal alloys, and the accuracy of these efforts varies widely. As well, Steinmetz models don’t factor in losses in the component winding caused by skin effects, proximity effects, and similar issues. Nor do these methodologies include ac losses of the windings.
Finally, it is not practical to estimate losses in components which use more than one magnetic material.
A new ac loss model
Because of such difficulties, Würth Elektronik eiSos has developed a state-of-the-art model aimed at an easier optimization of systems containing inductors. The model is based on empirical data derived from real time application set ups.
In the Würth model the total loss of the inductor is divided into two separate ac and dc losses. The power dissipation is due to dc current in the inductor windings and is listed as the dc loss. The additional power loss due to ac flux swing in the coil and the core is termed the ac loss.
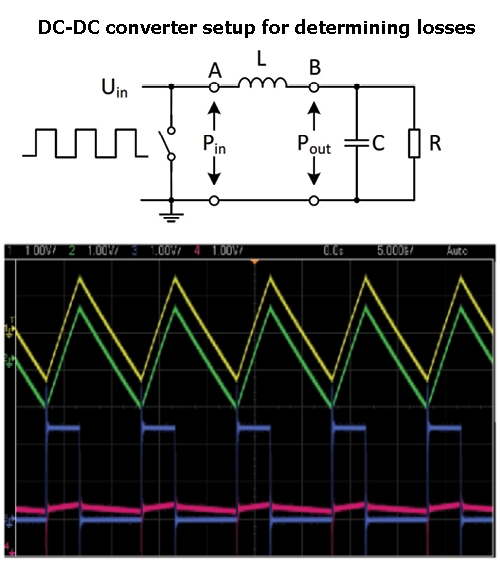
To produce empirical data, a pulsating voltage is applied to a simple LC circuit and load resistance. The power input, Pin and power output Pout (across the capacitor in parallel with the load) are measured. Then Ploss=Pin–Pout is estimated and the ac loss of the Inductor PAC is separated out. This process is repeated over wide range of parameters including variation of peak flux density swing, frequency, ripple current, and so forth, to produce the empirical data. This empirical data is then used to create an equation to calculate ac loss in the form of PAC=f(∆I,freq, DC, k1, k2).
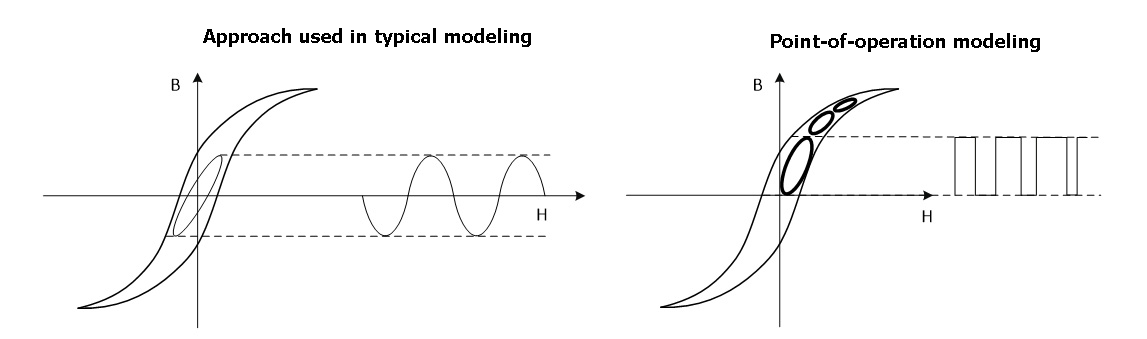
The hysteresis loops shown in the typical core material data sheets represent the core overdriven by a sinusoidal waveform from + to – saturation. The hysteresis loop area represents energy loss. This is the same approach used to produce empirical data for the core loss charts.
Of course, in an SMPS application, the core is usually driven by a much smaller rectangular waveform with peak flux density limited by core losses to a minor hysteresis loop. Power loss depends on how many times per second the hysteresis loop is traversed. Thus, hysteresis loss varies directly with frequency. The hysteresis loop changes shape somewhat with wave shape, current or voltage drive, and temperature. This variability, makes it hard to predict core loss accurately.
The minor loop area depends on the voltage above the inductor. Würth Elektronik’s ac loss model uses his minor loop in a point-of-operation approach to produce empirical model data. This approach has proven to be robust and accurate over a wide range of parameters like frequency, ripple current and duty cycle.
In Würth Elektronik’s ac loss model, empirical data is purely based on real-time parameters with accurate estimation of losses for any given duty cycle. The model is also accurate over a wide range of frequencies (10 kHz to 10 MHz) as the constants of the power equation are derived over a wide range with respect to the flux swing. And the model works for even small changes in core material and winding structure.
Moreover, Würth Elektronik’s ac loss model is valid for components which have more than one material. It will accurately estimate losses of iron powder and metal alloy materials and is valid for any core shape and winding structure. And it includes dc winding losses.
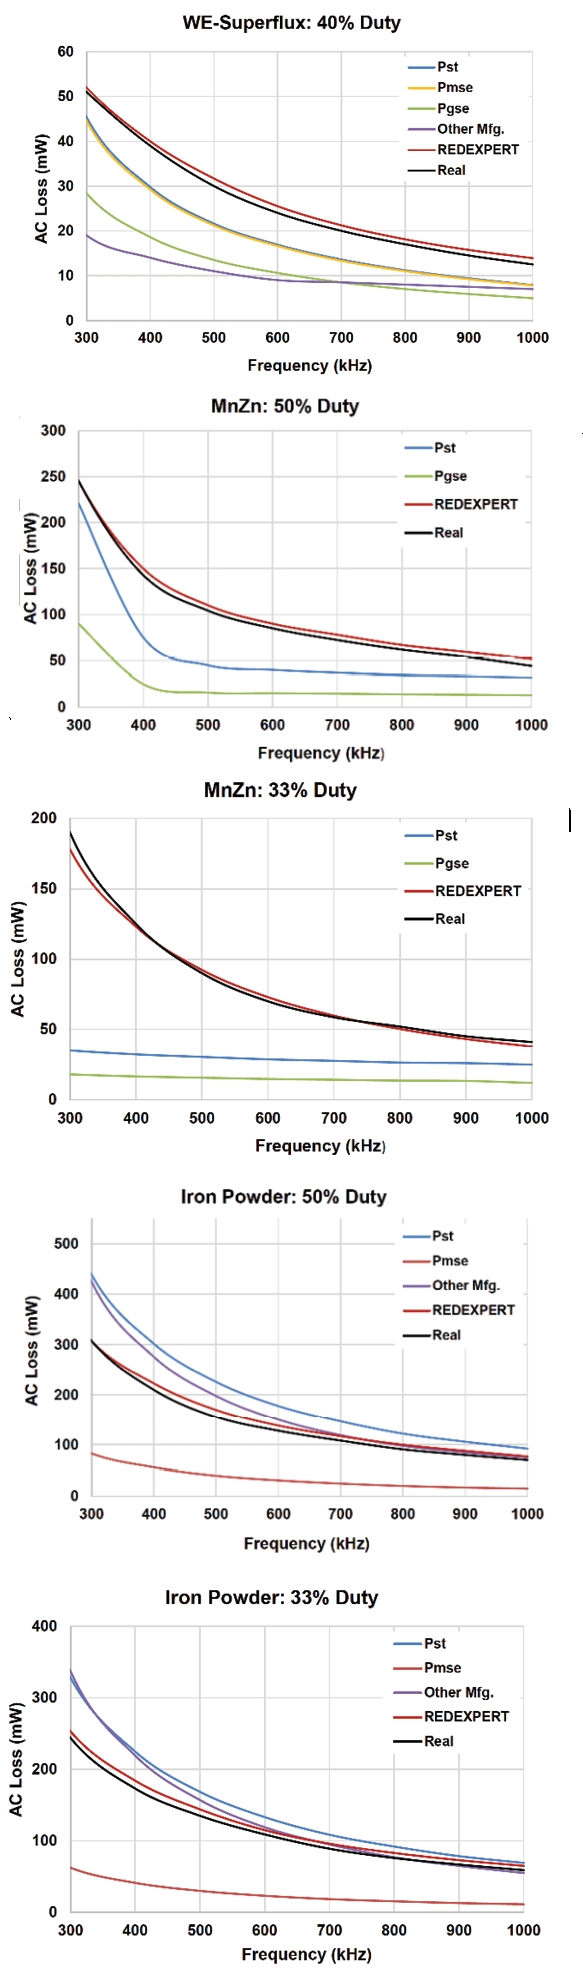
Würth Elektronik model has been validated and compared with existing models and measured data. The ac loss for various materials like WE-Super flux, iron powder, NiZn, MnZn, and so forth, are measured at a wide range of duty cycles, frequencies and other parameters compared with theoretical models.
The Würth Elektronik’s ac loss model is accurate and practical. The model has been experimentally verified over a wide range of frequency, ripple currents and duty cycles and proved to be robust. This ac loss model is implemented in an online selection tool called Redexpert, eliminating the need for design engineers to request core loss charts.
References
Magnetics Design for Switching Power Supplies, by Lloyd H. Dixon. Available online from Texas Instruments
On the law of hysteresis, by C.P. Steinmetz. Available online from several sources including here
Calculation of losses in ferro- and ferrimagnetic materials based on the modified Steinmetz equation by Reinert, J.; Brockmeyer, A.; De Doncker, R.W.
Improved calculation of core loss with nonsinusoidal waveforms by Jieli Li; Abdallah, T.; Sullivan, C.R.
REDEXPERT, www.we-online.com/redexpert


Leave a Reply