The Joulescope is an inexpensive test instrument designed to let developers of embedded systems get a good look at the energy and power consumption of their hardware during important events such as interrupts and wake-up sequences. Developed by a company called Jetperch, Joulescopes are about to become available through a Kickstarter campaign launching Feb. 19.
 Jetperch recently loaned us a beta unit so we could get a feel for how the Joulescope works.
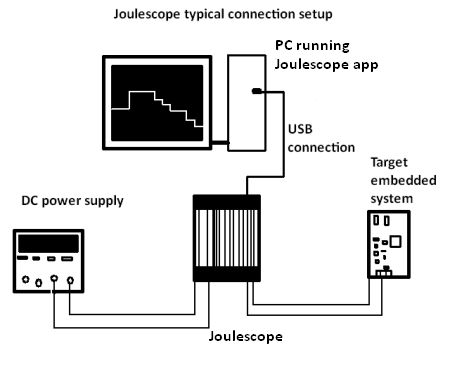
In a nutshell, the Joulescope connects between the power source and the power lines going to the target system, so it is basically in series with the target load. A key point about this connection is that most multimeters and current meters have a significant voltage drop which effects the actual voltage delivered to the device under test. But the Joulescope has a total voltage drop of 25 mV at 1 A, low enough to keep most target devices running correctly. And the Joulescope maintains the low voltage drop even under rapidly varying current demands.
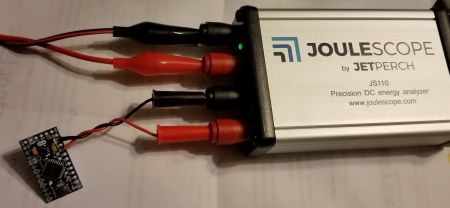
Additionally, the Joulescope is optimized for measuring current consumption over a wide dynamic range. We easily viewed currents in the nanoamp range, and the device will accommodate targets consuming up to 10 A. A zooming function lets the user get a detailed view of tiny consumption levels.
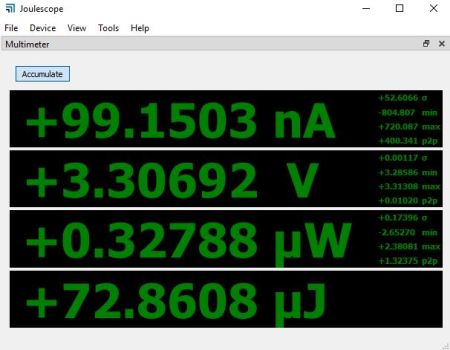
The Joulescope generates a display through a USB connection to a PC which runs a Joulescope app. (A point to note: The Joulescope gets power through its USB connection. This power connection is isolated from the target power supply, a fact we didn’t check but which was verified in a review by Jack Ganssle of the Ganssle group.) There are two display modes, a DVM-like numeric display (averaged over each half second) of target current consumption, voltage, dissipated power and energy (the integration of power over time); and an oscilloscope-like real-time display of target-system supply voltage and current.
However, there’s an important difference between what a scope would display and what the Joulescope provides: The Joulescope also depicts a min and max level for voltage and current. These are useful because each of the pixels in the display are actually represented by multiple underlying samples. The min and max displays are the true min and max of the pixel level. So you don’t miss any min or max values in the supply line.
The Joulescope samples at a 2 Msps rate, high enough to make visible the power consumption of
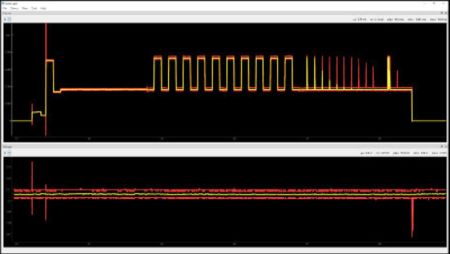
interrupt service routines, inrush currents, and similar events. The target device we used for checking out the Joulescope was an Arduino board containing an LED that flashed to give a varying current consumption.
As in the case of ordinary scope displays, you can zoom in on portions of a Joulescope display, but in the case of the Joulescope, you are truly zooming in rather than just changing the time base for a better look. (We found the display manipulations such as zooming and panning worked best with a mouse rather than a trackball controller.) Jetperch says it will be adding markers in an upcoming release of the Joulescope software that will let the user measure between specific points on captured waveforms in a way analogous to what’s possible on traditional scopes.
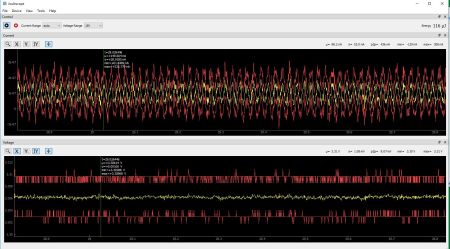
The energy read-out is interesting. Besides giving the basic info, it also reads out statistics – min, max, standard deviation, and peak-to-peak – for each half-second interval. The point of the read-out for energy is for making comparisons. The typical scenario consists of getting an initial read-out of total consumed energy, making a change, and then looking at the new energy figure to see whether there’s an improvement. There’s also an accumulate button that lets the user accumulate data over more than the default half-second interval. This is useful for seeing peaks over some sequence of events.
Potential users of the Joulescope should be aware that its scope display doesn’t really trigger on a level or event as is usually the case with an ordinary scope. To view an event, the user reviews the contents of the Joulescope’s data buffer, typically about 30-seconds-worth of waveform capture. This effectively means you can’t turn on the Joulescope, leave to get a cup of coffee and come back to see what happened. You have to be peering at the screen to note something of interest is in the data buffer.
Other points of interest: The Joulescope comes equipped with banana jacks for the power and target connections, but the front panels are open source so these connections can be swapped for something else. The Joulescope software is also open source on GitHub, so presumably it should be possible to do some customization for specialized needs.
The Kickstarter campaign for Joulescope is set to kick off 2-19-19.


Leave a Reply