A Bode plot represents the gain and phase of a feedback system as a function of frequency. It was developed by Hendrik Wade Bode in the 1930s and reflects the system’s frequency-domain behavior. He invented it while at Bell Labs to help design stable amplifiers with the feedback needed in telephone networks. The graphical design of a Bode plot charts the gain margin and phase margin needed to ensure stable operation when dealing with circuit variations resulting from manufacturing or during use. Bode plots have been extended to design servo systems, power supplies, and other systems with feedback controls.
This FAQ looks specifically at the use of Bode plots in the design of switching power supplies. It starts with a general overview of Bode plots as used with power supplies, then briefly reviews two methods of developing Bode plots: standard oscilloscopes and specially designed frequency response analyzers.
The converter loop transfer function defines the regulation characteristics of a power supply and can be illustrated with a Bode plot. It gives designers important information about the speed of the control loop and the stability of the power supply output.
A basic power supply feedback loop is pictured below. It consists of a power processing block, also called the modulator or plant, and an error detecting block called the error amplifier or compensator. Depending on the design, an output variable, such as voltage, is measured and compared to a reference. The difference between the two is inverted then amplified and used to control the plant. At low frequencies, this works well. But at higher frequencies, reactive elements in the circuit, including parasitic elements and various time delays, cause phase shifts in the feedback loop. Too much phase shift causes instability and oscillation as the feedback becomes positive.
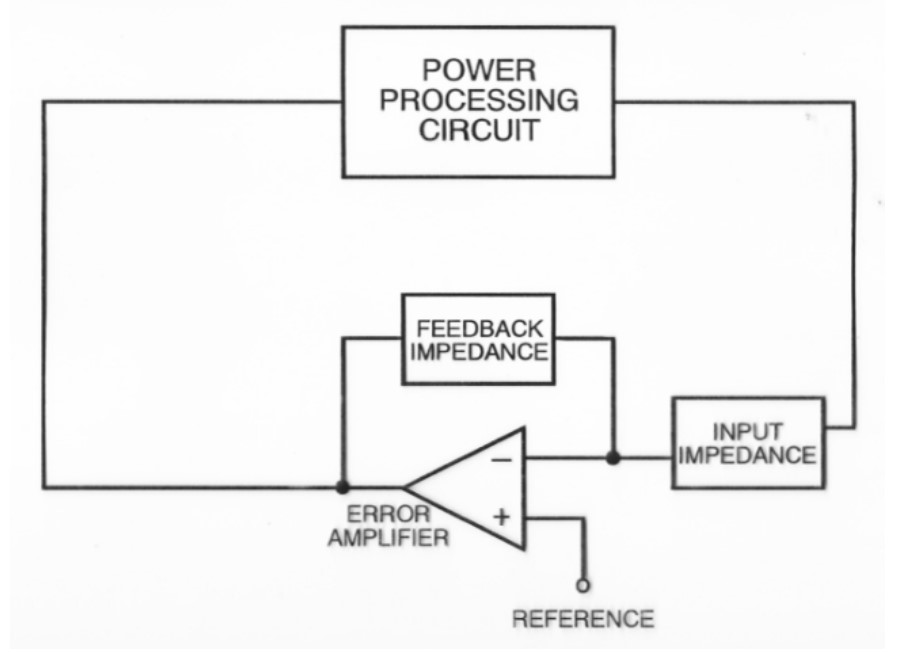
An ideal power supply design would respond quickly to load changes and maintain a stable output voltage. In a real power supply design, component variations and other factors can too easily result in an unstable feedback loop, poor regulation, and slow dynamic characteristics. Control loop measurements are needed to understand how a power supply design responds to changing load conditions. Power supply stability is complex, and measuring the actual gain and phase of the circuit over a range of frequencies is often more effective and accurate than reliance on only simulation.
Bode plot analysis is needed to ensure loop stability in switching power supplies under all load and line conditions. Two elements need to be considered: The feedback loop’s control to output transfer function has to be measured first when designing the feedback loop. Then, the error amplifier compensation can be designed to set the bandwidth or crossover frequency and the phase margin for the feedback loop. In the figure below, the loop gain is –GH, where G is the plant or power stage transfer function and H is the error amplifier or compensator transfer function. The negative sign is the inversion of the output of the loop typically caused by the inverting error amplifier.

To test the response characteristics of a power supply, a stimulus over a range of frequencies is injected into the feedback path of the control loop, and the reaction of the control loop is measured. Measurements of gain and phase are made at each frequency and used to construct the Bode plot. The optimal values of the gain and phase are application-dependent. When designing a power supply, the feedback loop is modified to produce the combination of response time and stability best suited to the needs of the application (referring to the figure below):
- Faster response to deviations from the target value results from greater gain at the 0 dB crossover frequency.
- Increased stability of the feedback loop results from higher phase margin at the 0 dB crossover frequency. This reduces the deviation from the target value to zero without oscillating and applies from a minimum of 45° of phase margin.
- Lower gain at higher frequencies can improve noise immunity.

Oscilloscopes and Bode plots
Bode plots can be produced using an oscilloscope, signal source, and automation software available from several oscilloscope makers. With the proper automation software, Bode plots can be generated quickly, making it easy to evaluate margins and compare circuit performance to simulation results.
Body plot measurement requires injecting an error signal over a band of frequencies into the feedback path of the control loop. The feedback loop needs to be broken to measure the loop gain by injecting a distortion signal into the loop. The injected distortion signal will be amplified or attenuated and shifted in phase depending on the loop gain. A small resistor is inserted into the feedback loop to enable the injection of the error signal. The 5 Ω injection resistor shown in the figure below is very small compared to the series impedance of R1 and R2. Some power supply designers automatically include a low-value injection resistor in their designs for test purposes. An injection transformer is needed to isolate the AC distortion signal and eliminates any DC bias. An oscilloscope can be used to measure the transfer function of the loop.

Two criteria need to be met for injecting the effort signal to ensure that the measured loop gain equals the real loop gain:
- The injection point needs to be where the loop is restricted to one single path to with no parallel signal flows.
- The impedance in the direction of the loop must be much larger than the backwards impedance at the injection point. The backwards impedance should be only several mΩ and equals the output impedance of the converter. The impedance in the direction of the loop is several kΩ and is formed by the compensator and the voltage divider.
Alternative Bode plot technique
In addition to using oscilloscopes, dedicated frequency response analyzers are available to measure feedback loop stability and develop Bode plots. These dedicated systems can present a different graphic representation of Bode plots. In the Bode plot below, gain and phase appear on the same plot, with the left-hand x-axis represents a gain in dB and the right-hand x-axis representing a phase in degrees. Phase is plotted from -180 to +180 degrees. Phase margin is measured from the 0 degrees of phase and determined by inspection, unlike a standard plot where the phase is subtracted from -180 degrees to get the phase margin.

The basic approach to determining the Bode plot is the same as using an oscilloscope: The transfer function is measured by injecting a signal into the loop and plotting the magnitude in decibels and phase in degrees of the output of the loop divided by the input versus frequency. The gain margin is the amount of open loop gain in dB at 360 or 0-degree phase shift that makes the closed loop system unstable. It is the difference in gain where the phase crosses 360 or 0 degrees and the measured gain. The phase margin is the amount of extra open loop gain phase shift at the unity gain crossover, making the system unstable. It is the difference in phase between the measured phase at the unity gain crossover and the 0 or 360-degree phase shift.
Summary
Body plots were originally developed to help designers of amplifiers used in the telephone system to ensure stable operation when dealing with circuit variations resulting from manufacturing or during use. Subsequently, Bode plots were extended to design servo systems, power supplies, and other systems with feedback controls. For power supply designers, a Bode plot provides important information about the speed of the control loop and the stability of the power supply output over all line and load conditions. Designers can choose from oscilloscopes, dedicated vector network analyzers (VNAs), or frequency response analyzers to produce Bode plots.
References
Bode Plot, Wikipedia
Comparing the Traditional Oscilloscope FFT to Spectrum View Spectrum Analysis for Measuring Power Supply Control Loop Frequency Response, Tektronix
How to Measure the Loop Transfer Function of Power Supplies, Texas Instruments
Power supply control loop response measurements (Bode plot), Rohde & Schwarz
Stability Analysis of Switching Power Supply Feedback Loops, Venable Instruments


Leave a Reply