
Advanced 1D and 3D computational fluid dynamics simulation techniques can help analyze the thermal properties of battery cooling packs powering electric vehicles.
Doug Kolak, Boris Marovic, Steve Streater | Mentor, A Siemens Business
The cooling system for an electrical vehicle’s battery pack is slightly less complex than that for a hybrid. It is generally a liquid-cooled system that includes the battery pack, preheater, pump, and coolant reservoir. The battery pack of an EV looks, electrically, like rows of cells. A medium-sized EV battery might consist of large cells divided into six rows with eight cells in each row.
The coolant flow can be either directly around the cells, with cold plates between them, or even around the other end of some heat pipes arranged between two battery cells. A thermal analysis with CFD can look at various design possibilities; there’s a need for flexibility because the design must be optimized for pressure loss and thermal management.
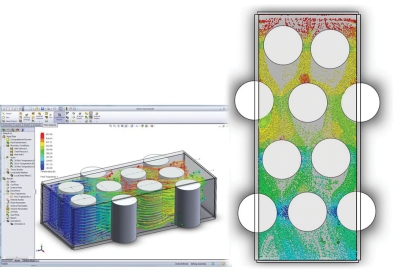
For an analysis down to the component level, 3D CFD allows a study of detailed flow and thermal behavior. Any unacceptable operation such as misguided flow patterns or extreme thermal gradients can be identified early in the design. Later in the process when the performance of the entire battery cooling system is the main concern, 3D CFD helps create a more accurate 1D system simulation, ensuring proper system performance.
Characterizing battery cells with 3D CFD
The main consideration in the design of a cooling pack is ensuring all cells in the battery remain at the same temperature. It is important to manage temperature in individual cells because high gradients within a battery cell can cause fast degradation and early failure.
A 3D CFD program can analyze flow paths through the pack as well as the pressure drop, velocity, heat transfer, and local temperatures to evaluate pack performance. In the past, highly trained specialists handled this type of CFD analysis; however, a CAD-embedded, 3D CFD thermal simulation tool such as FloEFD allows designers and engineers to analyze pressure drop and thermal performance without the need to call in a CFD guru. The tool runs natively from the same MCAD software used to design the battery cooling pack. Consequently, there’s no need to create a separate CFD model, and any redesigns can take place immediately. This strong CAD linkage is especially interesting when the design is at an early stage and a lot of changes are still necessary. The tight CAD linkage allows faster iterations of the overall thermal design while providing a good characterization of the battery cell.
In comparison, a 1D CFD tool called FloMaster is good for focusing the analysis on the overall performance of the system and for identifying how the components of the system interact. Overall performance data is difficult to capture and takes much longer using 3D CFD.
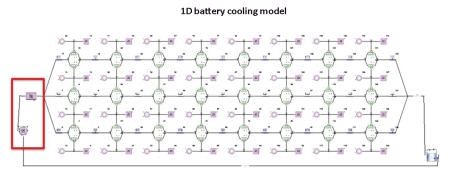
One of the important design considerations is how to model the battery cooling pack. It would be easy, and can be acceptable, to model it as a single lumped component using an overall heat transfer coefficient and combined thermal duty. However, accuracy is important, so the pack is modeled as individual cells to ensure the capture of any temperature gradients across the pack. This information can be handy in the event of redesigns. Also, the pressure loss and heat transfer associated with the piping in the system is considered negligible. Thus, the model excludes these parts of the system.
One of the biggest benefits of using 1D CFD is that analysis can take place quickly, especially for transient events. However, 1D CFD requires significant amounts of data to describe the physical phenomenon going on inside each component. But FlowMaster has a substantial built-in database of empirical data for a wide range of geometric components such as valves, bends, and junctions. This built-in information minimizes the need for finding performance data via testing or from the manufacturer.
The characterization data obtained from 3D CFD can be used inside the 1D model. For example, the battery cooling pack components in FlowMaster can use the characterization of the pressure loss as well as of the heat transfer from the FloEFD analysis. Once both the 1D and 3D CFD models are constructed, data such as the maximum heat rejection rate of 30 W/cell can be used for analysis in both software programs.
Analysis for peak condition cooling
Suppose we want to find an appropriate volumetric flow rate to keep the system under the 40 ºC critical temperature for a lithium-ion battery. The industry has used a 30–40ºC temperature band as the general guideline for preserving the lifetime of these costly battery packs. We’ll use a worst-case scenario to ensure the system can meet the heat rejection requirements without the use of the cabin A/C circuit often pressed into use for high-demand cooling applications.
We keep the heat rejection into the cooling system at 30 W/cell and vary the pump flow rate from 2 to 15 L/min when conducting a parametric study using the FloEFD simulation software. This heat rejection rate will determine the minimum pump volumetric flow rate needed to keep the battery pack under 40ºC using a 50/50 glycol/water coolant and 20ºC ambient temperature.
The minimum flow rate that ensures all sections of the battery pack stay below 40ºC is about 9.5 L/min or 2.5 gal/min. A simple crosscheck with the pump supplier can ensure that the pump selected for the system meets this requirement.
With the minimum volumetric flow rate determined, we’ll want to understand how the cooling pack performs under a range of operating conditions, particularly during changes in coolant flow rates and cell loads. Again, a parametric study of the cooling pack in FloEFD can produce data for a surface map of cooling pack temperature versus coolant flow rate and cell load. This map provides a quick reference showing the ideal conditions the cooling pack should see and gives an opportunity for redesign if necessary.
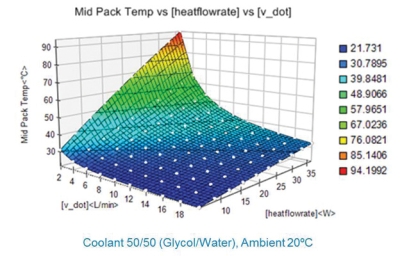
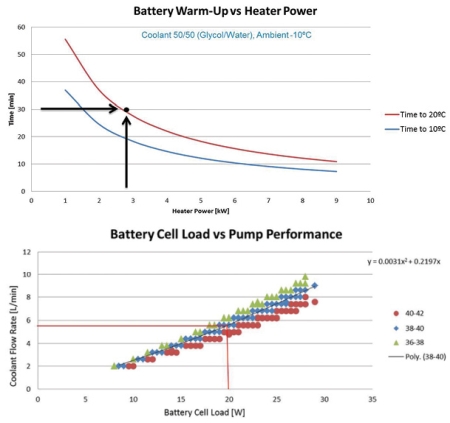
The surface map can be used to deduce a trend line that shows battery cell load versus pump performance. This data can serve as a starting point for tuning the pump control algorithms. For example, an intended battery cell load of 20 W requires a coolant flow rate of 5.5 L/min, which would allow the battery to stay below the critical temperature of 40ºC.
Besides helping to create a pump control algorithm, the surface map aids in characterizing the cooling pack’s thermal performance. This thermal data, along with the pressure drop data, is all that is required to model the cooling pack in FloMaster.
Warm-Up from cold start
After the initial component-level design has been vetted with 3D CFD analysis, it is important to investigate how it will perform within a system. A critical real-life challenge for EV battery systems is a cold start because there is no internal combustion engine to provide heat. Imagine a winter day in Chicago at -10ºC. The vehicle battery pack must reach an acceptable operation temperature (AOT) within a reasonable time. With no ICE to provide heat for cold startup, there’s a need for a positive temperature coefficient (PTC) heater.
Two quantities can be varied in this simulation, pump speed and PTC heater size. The acceptance criterion is the cooling pack reaching 20°C in less than 30 minutes.
In this example, we’ll analyze high and low pump speed with heat power ranging from 2 to 10 kW. Apparently, the pump speed has little influence over the total warming time. Running at half speed will reduce the load on the auxiliary battery while not affecting warm-up time.
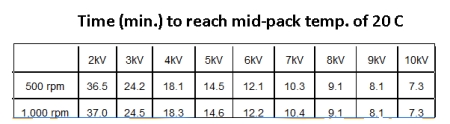
This insensitivity to pump speed means we need only vary the size of the heater in the design parameters. The smallest PTC heater that would work for the system is 3 kW which brings an AOT of 20°C in less than 30 minutes.
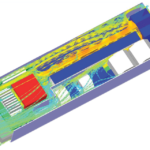
Now consider the time at which the front of the pack and the rear of the pack
get to the AOT during battery warm-up. In this example, the rear cells in the pack reach the temperature of the front cells after five minutes. The front cells sit closest to the heater.
Another interesting point in the warm-up study is that a snapshot shows a difference of 5ºC between the front and rear of the pack. If that difference didn’t meet design objectives, you could re-run the analysis with, say, a higher flow rate, an extra heater added for the rear cells, or the flow geometries reconfigured to create better flow around the pack

Great article! Your blog is very informative and useful. keep sharing with us.